A broader view of the data shows a growing map of New Jersey counties at high risk in an expanding public health challenge. These at-risk locales are not always the traditional hot spots that many people expect to see at the epicenter of New Jersey’s mental health and substance use disorder crisis.
The data clearly show that the largest volume of mental health emergency department visits are located in the urban and coastal counties of Essex (79,484 ED visits), Camden (54,731), Ocean (48,826), Monmouth (47,680) and Middlesex (47,251) counties, as expected. (See Map 1) However, raw volume only partially identifies the hot spots of concern in New Jersey. Use rates (the number of mental health emergency department visits per 1,000 population) and the growth rate in raw volume over a five-year period (2013-2017) identify other geographic areas of the state that are also in need of attention as policy makers and healthcare providers combat this crisis.
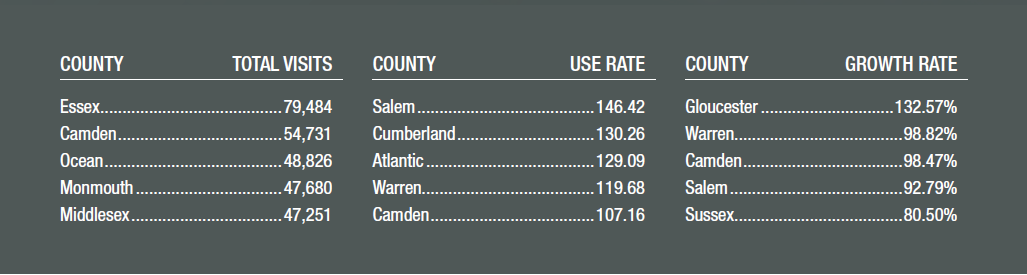
The top five counties for emergency department visits for the purpose of a mental health condition, when measured by visits per 1,000 population, are Salem (146.42 mental health ED visits per 1,000 population), Cumberland (130.26), Atlantic (129.09), Warren (119.68) and Camden (107.16). (See Map 2) While Essex County has the highest 2017 raw volume of 79,484 visits, Salem’s rate of emergency department visits per 1,000 population is 49 percent greater than Essex.
Finally, the rate of growth in raw volume over five years is also a key indicator of magnitude. The top five counties from a rate of growth perspective are Gloucester (+132.57%) which has seen its volume more than double, Warren (98.82%), Camden (98.47%), Salem (92.79%) and Sussex (80.50%). (See Map 3) Essex County, as a point of reference, has seen its raw volume increase by 3.27 percent over that same fiveyear period.
Efforts to address the rapid growth of service need for mental health, substance use and self-harm through strategic investments and collaboration need to account for these perspectives of magnitude. Camden County appears in the top five under all three measurement approaches, signifying heightened need for local solutions.
In New Jersey, hospital emergency departments are the 24/7 safety net for individuals in need of care, regardless of their socio-demographic or social determinants of health characteristics. CHART’s analysis uses Uniform Bill Data to help paint a picture of emergency department visits for mental health diagnoses, as either a primary or secondary diagnosis, from 2013 to 2017. More important, it deepens that picture with the landscape of growth and use rate among counties throughout the state. While the analysis is driven by the larger data set of behavioral health disorder diagnosis codes, particular attention is also given to individuals with a substance use diagnosis and those who inflicted self-harm.
SUB-FOCUS: Substance Use Disorders
 In 2016, 63,632 drug overdose deaths occurred in the United States.1 New Jersey experienced 2,056 drug overdose deaths during that same time.2 An estimated 88,000 people (approximately 62,000 men and 26,000 women) die from alcohol-related causes annually. In New Jersey this equates to about 1,760 alcohol-related deaths annually.3
With the exception of Ocean County, regarded as the center of the opioid crisis in New Jersey, the top five counties for volume based on emergency department visits for substance use disorders are: Essex, Camden, Atlantic, Middlesex and Monmouth counties. These five counties account for almost half (44.8%) of total statewide ED substance use disorder visits. Use rates are similar to the broader analysis of emergency department visits quantified earlier in this report, with a mix of some rural counties. The top five are Atlantic, Salem, Warren, Cumberland and Essex. Atlantic and Essex counties appear in the top five for both highest number of visits and highest use rate, suggesting that these counties are experiencing heightened levels of activity and are in need of augmented intervention services and care coordination.
SUB-FOCUS: Self-Harm
 Nationally, nearly 45,000 individuals died by suicide in 2016. Rates went up more than 30 percent in half of the states since 1999; between 1999 and 2016 New Jersey’s suicide rate has increased 19.2 percent.4 Although in 2016 the state’s suicide rate decreased for the first time since 2011, an alarming 687 deaths occurred during that year.5
Accounting for more than half (56%) of total statewide emergency department visits for suicide-related conditions, the top five counties for volume based on emergency department visits are Ocean, Essex, Morris, Middlesex and Hudson counties. Use rates are highest in a mix of urban and rural counties, with the top five counties being Ocean, Atlantic, Warren, Morris and Cumberland counties. Counties that are highest in both total statewide emergency department visits and use rates are Ocean and Morris counties, suggesting the need for a more acute analysis to determine the root cause of this exponential level of activity.